Monitoring BigQuery with Stackdriver
I have done several talks about BigQuery over the past two years. It was the first Google Cloud Platform product that I fell in love with. It is both simple to use (everyone knows SQL) and incredibly powerful (multiple TB with aggregation in < 30 secs?!?!?). One thing I have wondered is how I would monitor BigQuery to ensure that everything was working as expected. In the past, I ran data warehouse and log analysis tools on their own VMs and then monitored them the same way I would monitor any VM. However, I cannot do that when I am using a managed service like BigQuery. Managed services have so many advantages over running my own VMs that this week I sat down to learn the tools that were available for monitoring BigQuery using Stackdriver.
Setup and Basics
You can access Stackdriver Monitoring from Cloud Console. If you have not used Stackdriver before you will need to link Stackdriver to your Cloud Platform account. The UI walks you through the process; it just takes a minute or two. Once you are on the Stackdriver dashboard, you should see BigQuery under the resources menu. If BigQuery is not a listed resource, you may need to wait a bit. There can be a bit of a delay between creating new resource types and having them appear in the Stackdriver UI. I connected Stackdriver to my GCP account before I created my dataset and it took about an hour for it to appear in the UI.
I used the GitHub dataset I used in this blog post and the Iris dataset that is popular in machine learning textbooks. Monitoring tools are boring if there isn’t any load, so I wrote a quick Ruby script to run queries against both datasets as I explored. Once I verified that BigQuery and Stackdriver saw the traffic, I dove in.
Metrics
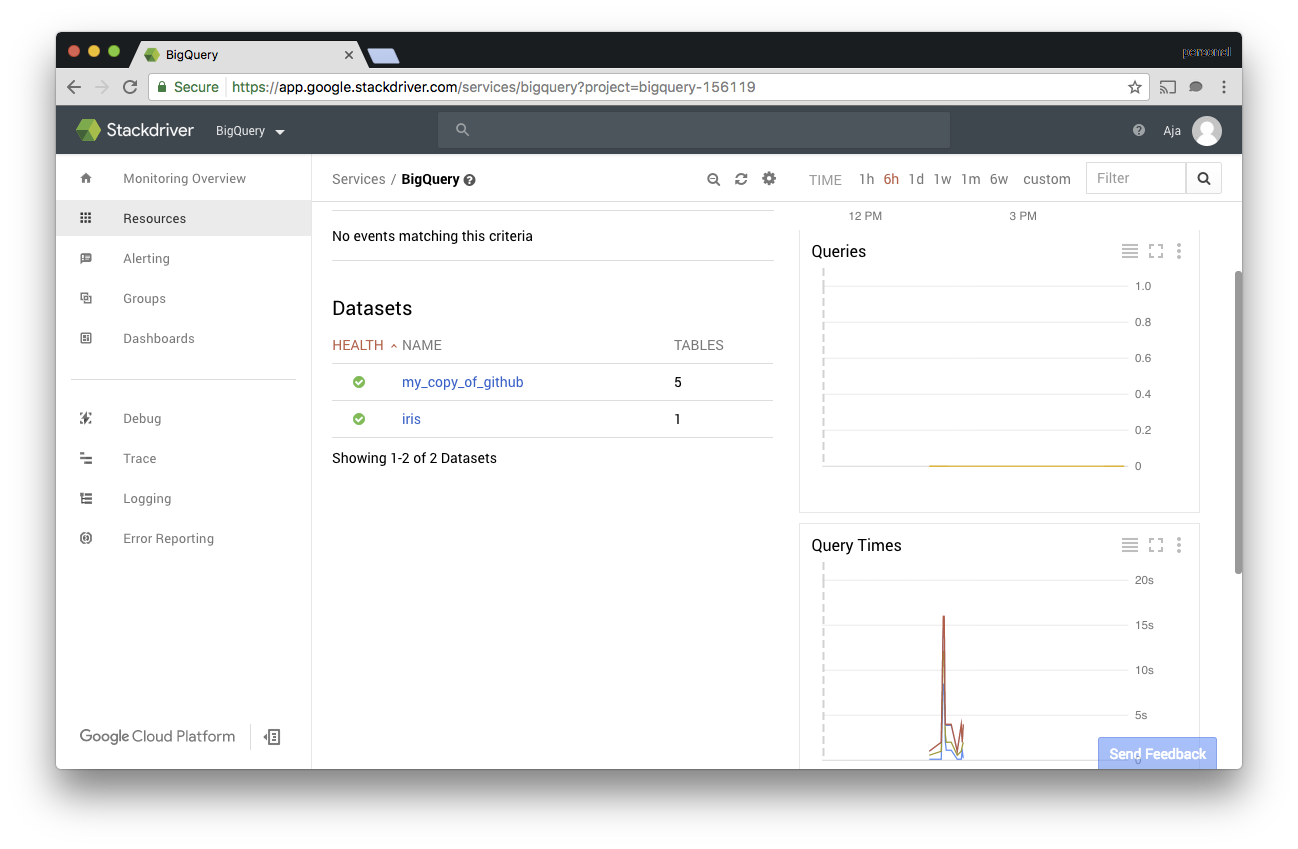
The default dashboard shows the live query count, query times, and slot utilization. If you switch to dataset metrics you can see the number of tables, stored bytes, and uploaded bytes over time. You can also see this data by clicking on the dataset name.
I used static datasets, so the dataset metrics were pretty boring for my project. However, I could see how the query time changed as I changed the queries my script was using. Also, as I spun up more instances of my script, I saw the query count increase.
Alerting
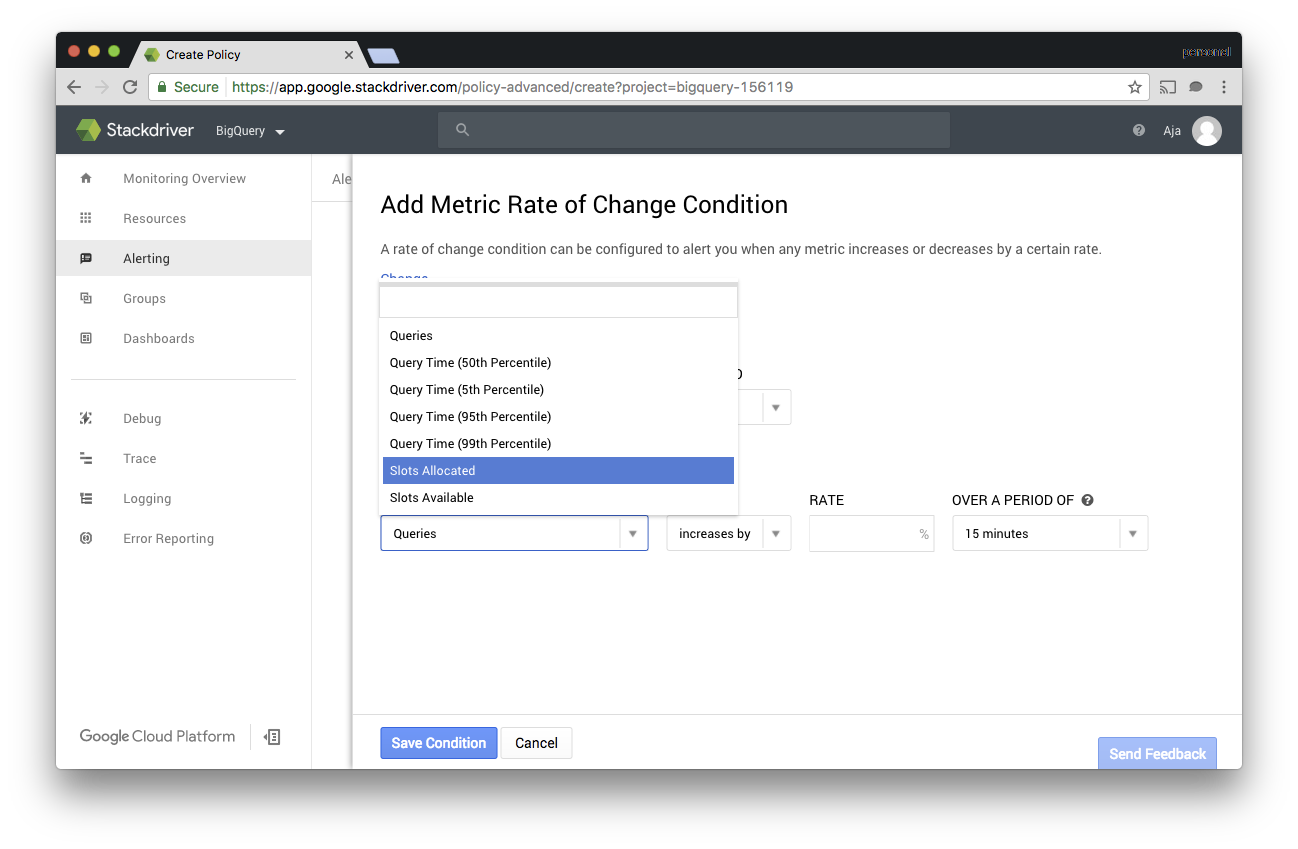
For most folks monitoring and alerting are one and the same. To see what kind of alerting metrics are available for BigQuery I created some alerting policies under “Alerting” -> “Create Policy.” With VMs the types of metrics I use most are Metric Threshold and Metric Rate of Change. Both these types are supported for BigQuery as well.
I set up a threshold metric that none of my queries should take more than 30 seconds and another that the 50% percentile should not be more than 5 seconds. I based these alerts on problems I had had with data warehouse and custom report generation in the past. Without the ability to get real-time metrics out of the database I had to put alerts on page render times and then step through the pipeline to figure out if the problem was in the HTML view, the business logic, or a slow query.
I also set up a few metric rate of change alerts. I set up one that detects if the raw number of queries was decreasing significantly over time. If I had more users doing ad hoc queries against my datasets I would set up an alert on the rate of change for slots allocated. That way I could track down the queries that were causing the increase before I hit the slot quota.
Dashboards
Stackdriver lets you create custom dashboards as well. When I am setting up monitoring for a website, I like seeing the 95%, 50%, and 5% response times overlaid. I feel like that gives me a better feel for overall system health and user experience than just seeing the average. I created a similar dashboard for my BigQuery datasets.
You can also mix BigQuery charts and charts for Compute Engine, App Engine, and other resource types on the same dashboard so that you can see your system as a whole in one place.
Resources
For more information about setting up Stackdriver for BigQuery and the types of metrics available, please check out the documentation.